


Data Insights Hub:
Unleashing the Power
of Brivo Analytics
Brivo Data Intelligence Shows Building Occupancy Levels Across America
Methodology: “Occupancy is calculated as number of daily unique users compared to the pre-Covid daily average in February 2020. Calculated for regular working days, excluding weekends and holidays.”
Brivo Occupancy Data
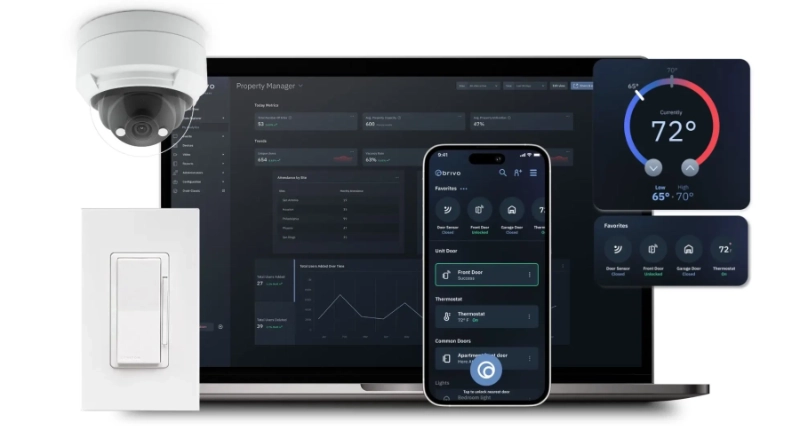
Brivo provides insight into how people are occupying and using physical space in different industries and locations by using data from connected buildings and credentialed users.
This will give us a better idea of the trends of America and how we are returning to the office.
Methodology
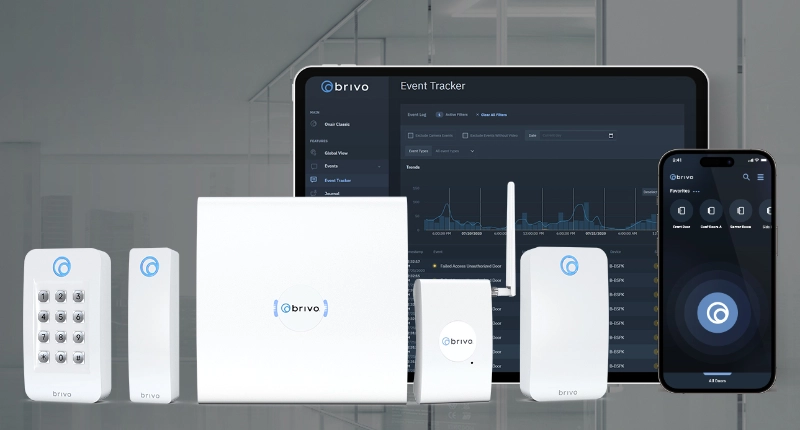
Brivo has the largest data set for smart building access control securing 450+ square feet of real estate in 90K commercial sites globally.
Our comprehensive data set shows trends in building occupancy as work environments
change over time.

Brivo Data
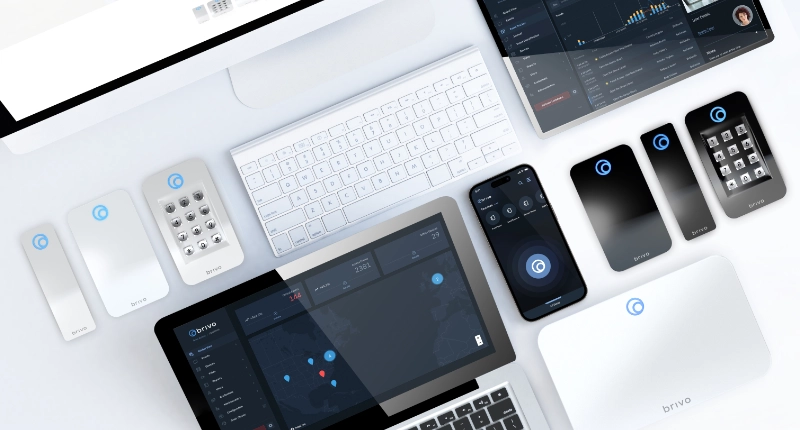
Our data highlights how workers have adapted to remote work and using physical space in a post-COVID working environment.
TRENDS IN THE
WORKPLACE
OCCUPANCY BY DAY
OF THE WEEK
OCCUPANCY BY
INDUSTRY AND CITY
Nationwide Occupancy
The above chart lets you look at our entire dataset on cities and occupancy data, as there are many stories that can be told based on smaller metropolitan areas that were not highlighted.
Change in Daily Active Users by Industry
Brivo data tells a similar story when we look at eleven metropolitan areas across the country. We see that the country has returned to work above the pandemic levels, but we are still below the pre-pandemic levels. The most interesting descriptors are, of course, city and industry.
When we look specifically at the top ten sectors on the Brivo index, all ten have seen workers return Post-Pandemic, up on average 35% from Mid-Pandemic, with Retail, Mining, and Finance/Insurance/Real Estate rounding out the top three. However, when we look at Pre-Pandemic to Post-Pandemic, only three industries have increased: Agriculture/Forestry/Fishing, Construction, and Retail.
Revitalizing the Workplace:
How Brivo Data is Helping Downtown Austin Alliance Safely Bring Employees Back. Learn how Brivo Data is making it possible
Featured In


How to Buy


How To Buy
